Exclusive Review: UTI Nifty 200 Momentum 30 Index Fund
A compelling product which offers investors a low-cost option to invest in a momentum based investment strategy
Note to our dear readers: We reviewed this product based on interest expressed from some of our followers. If you want us to write about something in particular, do drop us a line and we will try our best.
The soon to be launched UTI Nifty 200 Momentum 30 Index Fund is a first of its kind mutual fund scheme to be launched in India. This fund will explicitly follow a rule-based momentum strategy and invest in stocks which display good momentum. Some balanced funds or balanced advantage funds do have momentum characteristics, but such funds do not explicitly follow momentum investing. This makes the UTI product a unique offering in the Indian mutual fund landscape.
What is “momentum”?
Momentum refers to the phenomenon in which stock price movements display persistency, i.e., stocks that have outperformed recently are likely to continue to outperform, and stocks that have underperformed are likely to continue to underperform.
Is there academic backing to the momentum phenomenon?
In 1993, the seminal paper by Jegadeesh and Titman titled “Returns to Buying Winners and Selling Losers: Implications for Stock Market Efficiency” documented that momentum based investing is able to generate higher risk-adjusted returns. Since the publication of this paper, several studies in different geographies have documented the prevalence of momentum in stock prices.
In fact, momentum in stock prices has been prevalent long enough for it to earn the title of the “premier anomaly” by none other than Eugene Fama (et al.), the father of the Efficient Market Hypothesis.
Why do stock prices exhibit momentum?
There is no consensus on why there is persistency in the way stock prices move. Various reasons are expounded like new information gets incorporated in stock prices over a period of time rather than instantaneously, herd mentality, other behavioral factors, etc.
The important thing to understand is that stocks exhibit momentum- the exact reason is hazy.
Background to the UTI Nifty 200 Momentum 30 Index Fund
Momentum investing is a type of “factor” investing. A factor is an attribute that explains the risk and return performance of a stock. For instance, growth is a factor that is attributed to the performance of growth stocks. Similarly, the value factor is attributed to value stocks. There are also factors which capture the size of a stock (largecap, midcap or smallcap). A portfolio can be constructed using such factors, like a growth-oriented portfolio. You can also combine multiple factors in a portfolio - like growth and smallcap oriented portfolio.
The UTI Momentum Index Fund is a single factor fund that uses the momentum factor for portfolio construction.
The Fund will replicate the Nifty 200 Momentum 30 Index, which is constructed as follows,
The index has a base date of April 01, 2005, with a base value of 1000
The index tracks the performance of the stocks that are part of the Nifty 200 Index and have high momentum scores
The momentum score is computed based on 6-month and 12-month price return, adjusted for return volatility
The weight of each stock in the Index is based on its momentum score
Return Performance
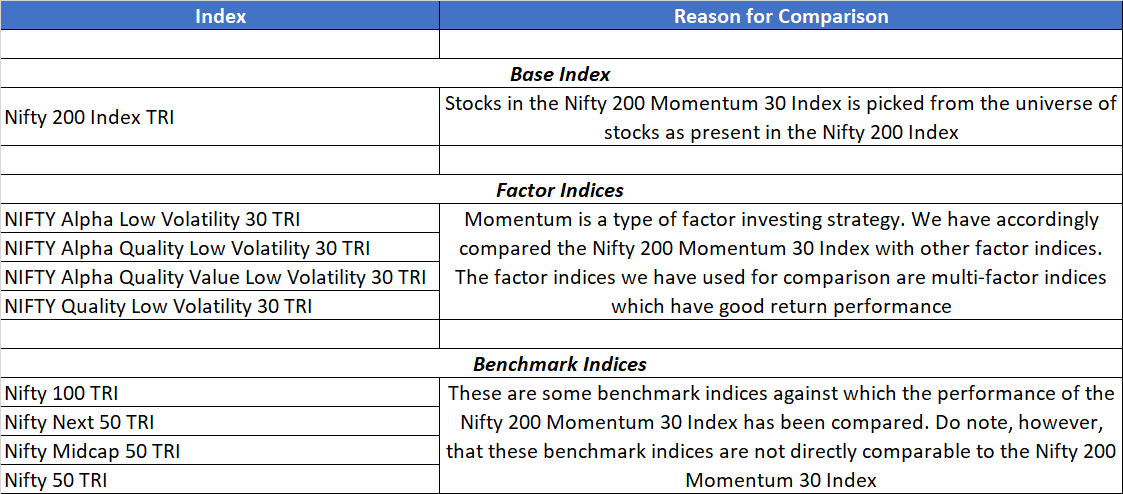
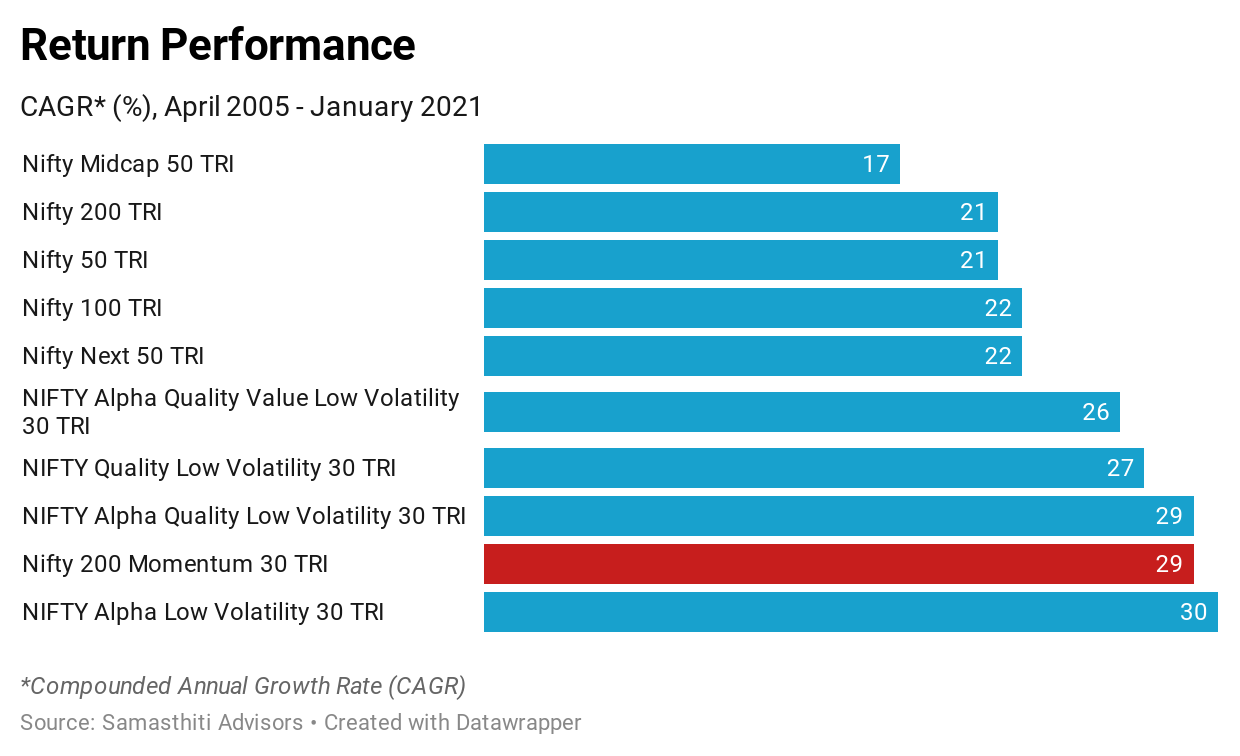
Let us first look at how the Nifty 200 Momentum 30 Index has performed. We have compared its performance with the following other indices,
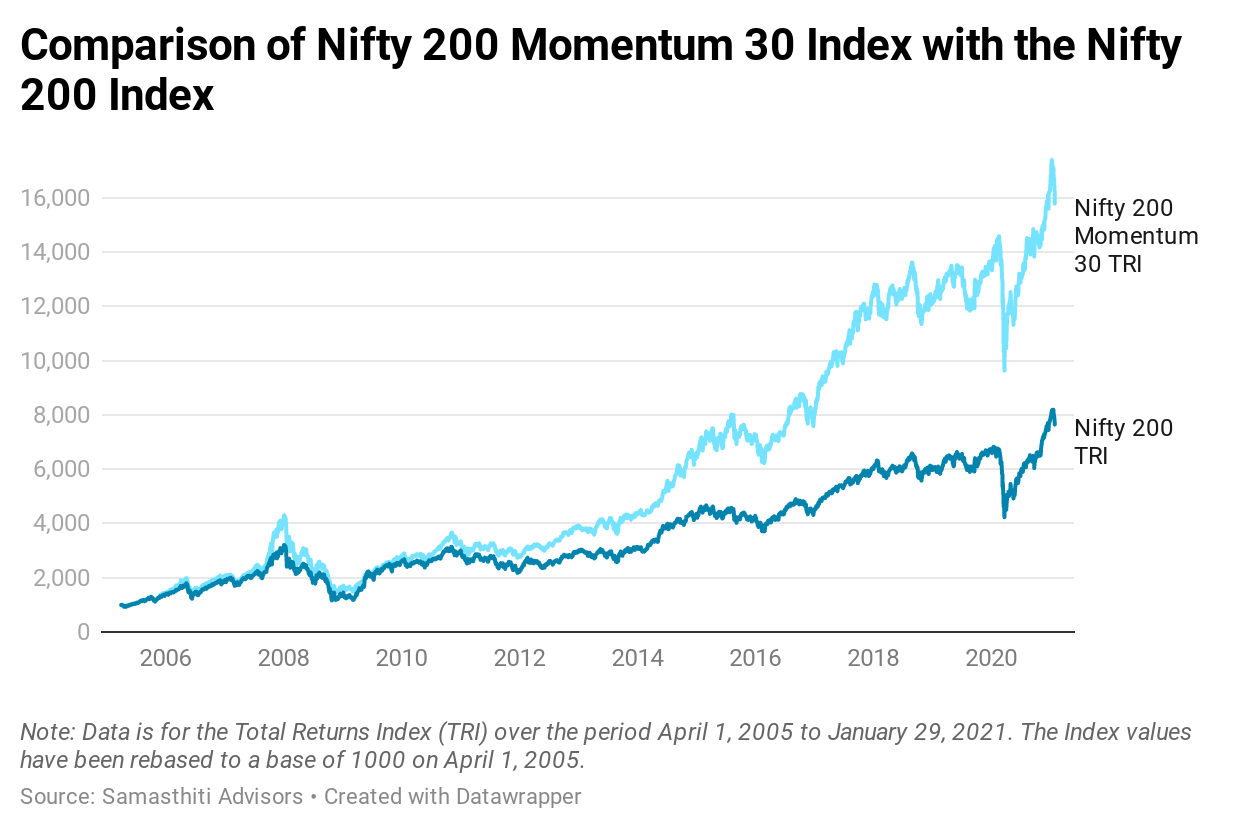
As expected, the Nifty 200 Momentum 30 Index convincingly outperforms the Nifty 200 Index. Over the period April 2005 to January 2021, the Nifty 200 Momentum Index has delivered a return of 29% CAGR as compared to 21% CAGR for the Nifty 200 Index.
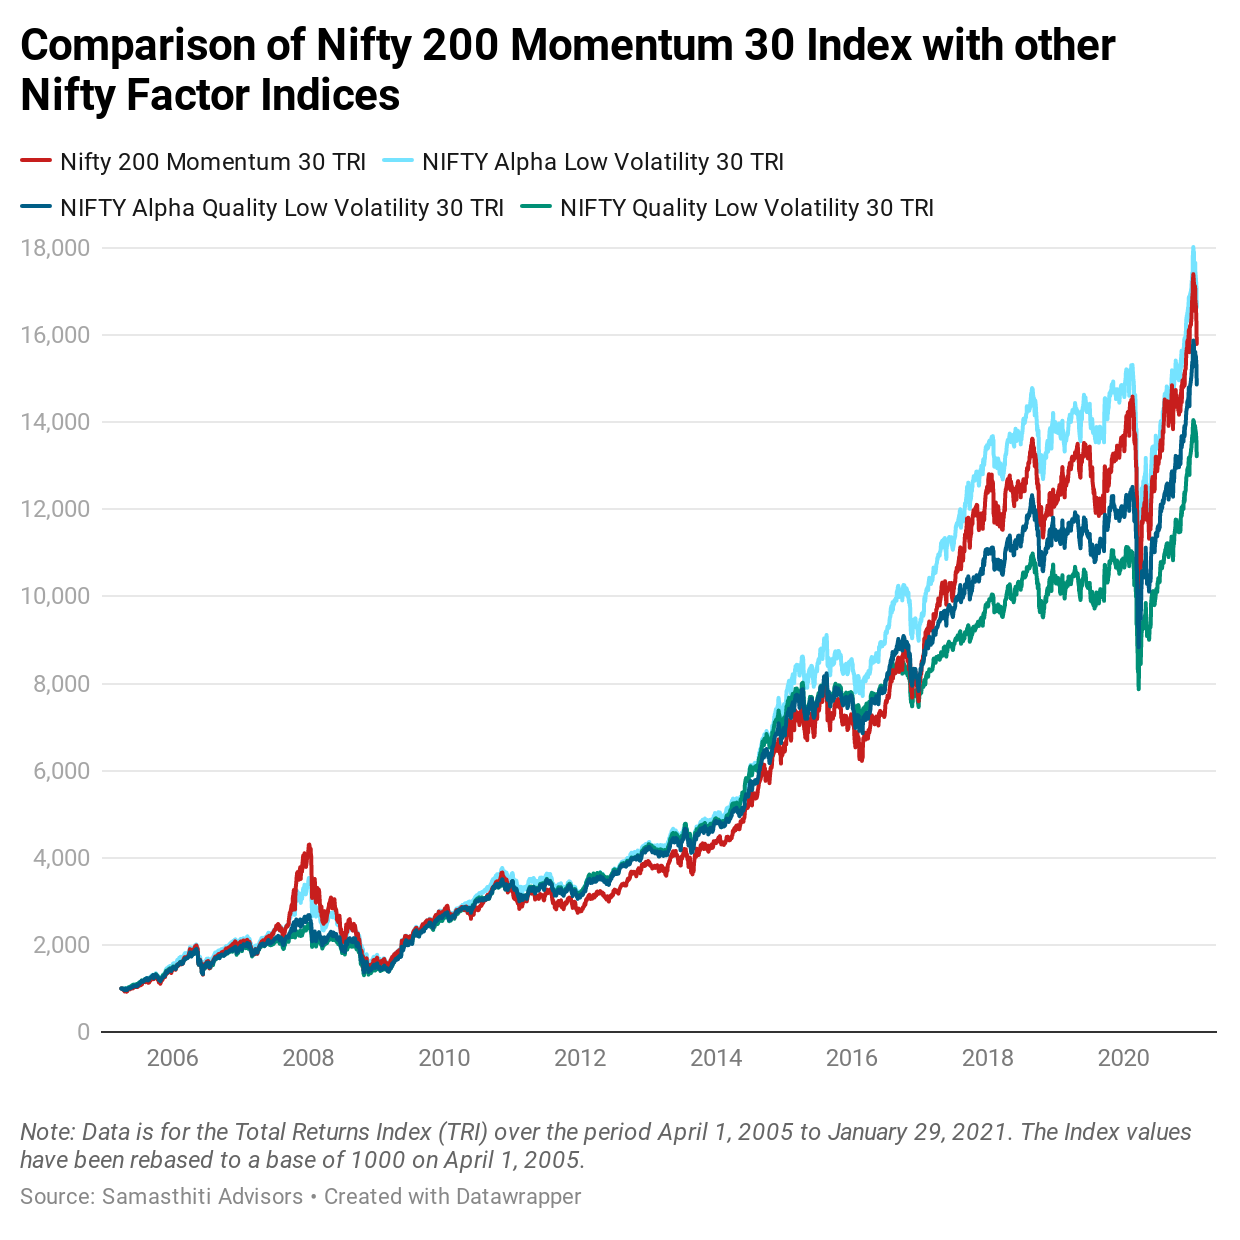
The comparison of the Nifty 200 Momentum 30 Index with the other Nifty factor indices is a close call. The Nifty Alpha Low Volatility 30 Index (30% CAGR between April 2005 and January 2021) betters the momentum index (29% CAGR over the same period), with the other factor indices coming close to the return performance of the momentum index, but not quite beating it.
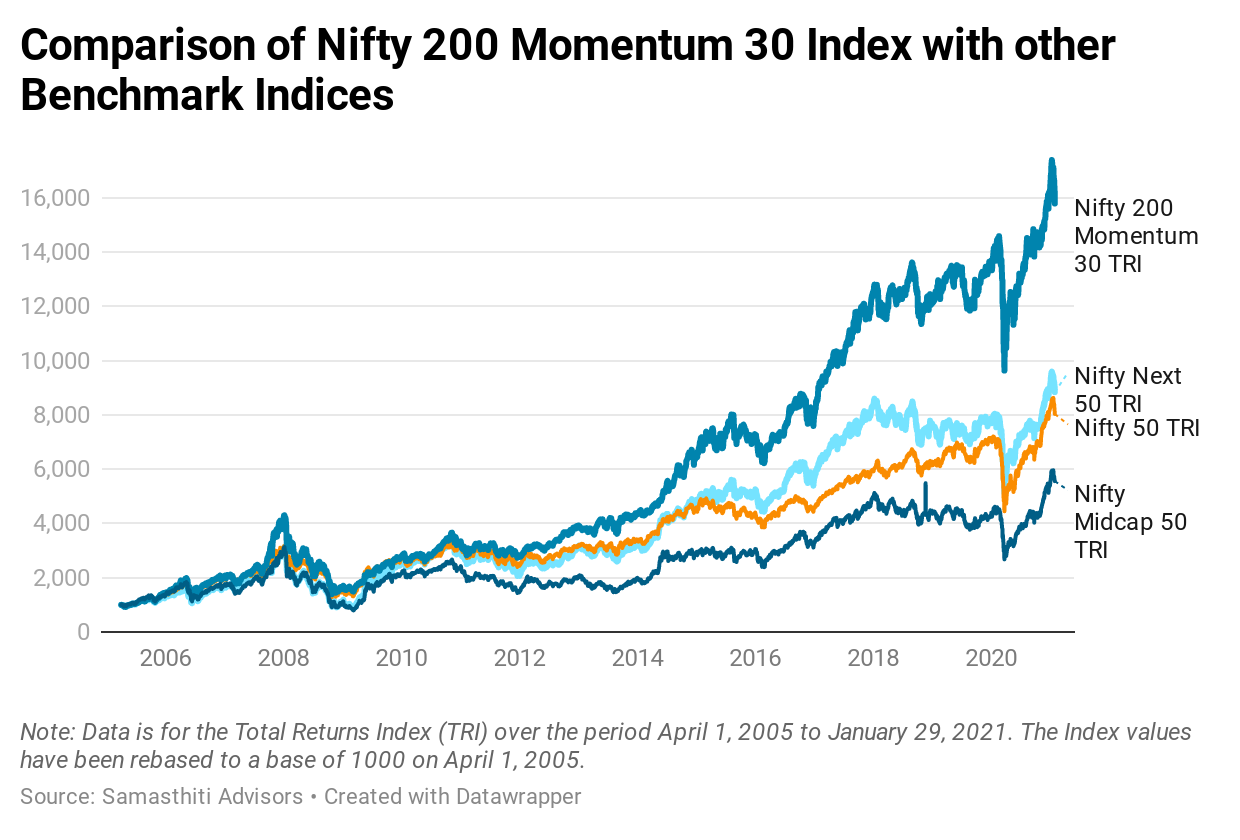
Finally, we have also compared the performance of the Nifty 200 Momentum 30 Index with other benchmark indices. Do note however that the below benchmark indices are not directly comparable to the Nifty 200 Momentum 30 Index.
Undoubtedly, the Nifty 200 Momentum 30 Index has managed to deliver superior performance when compared to a host of other indices. Perhaps this is not surprising as the Index is primarily a back-tested Index.
Risk Performance
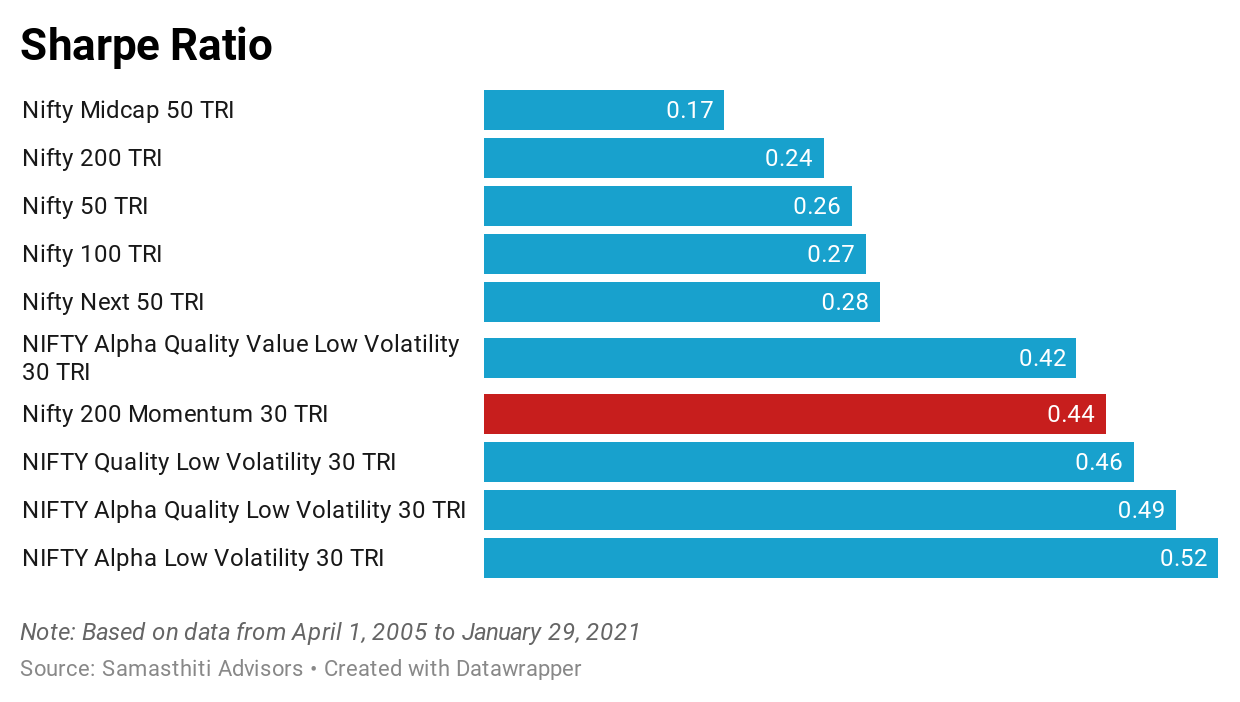
The return performance is, of course, only one side of the coin. While investing, we need to be cognizant of the risk performance as well. It is little solace if an investment delivers high returns but such returns come with significant volatility. For comparing the risk-adjusted returns, we have used the Sharpe Ratio. Higher the Sharpe Ratio, better is the risk-adjusted potential of an investment.
As can be seen in the above graphic, the Nifty 200 Momentum 30 Index delivers a good Sharpe Ratio score which is bettered only by the Nifty multi-factor indices. The reason the ‘low volatility’ multi-factor indices like the Nifty Alpha Low Volatility 30 Index has a better Share Ratio score than Nifty 200 Momentum 30 Index is that while the return performance of both these indices are similar, the Nifty Alpha Low Volatility 30 Index has a lower standard deviation or volatility (true to its label).
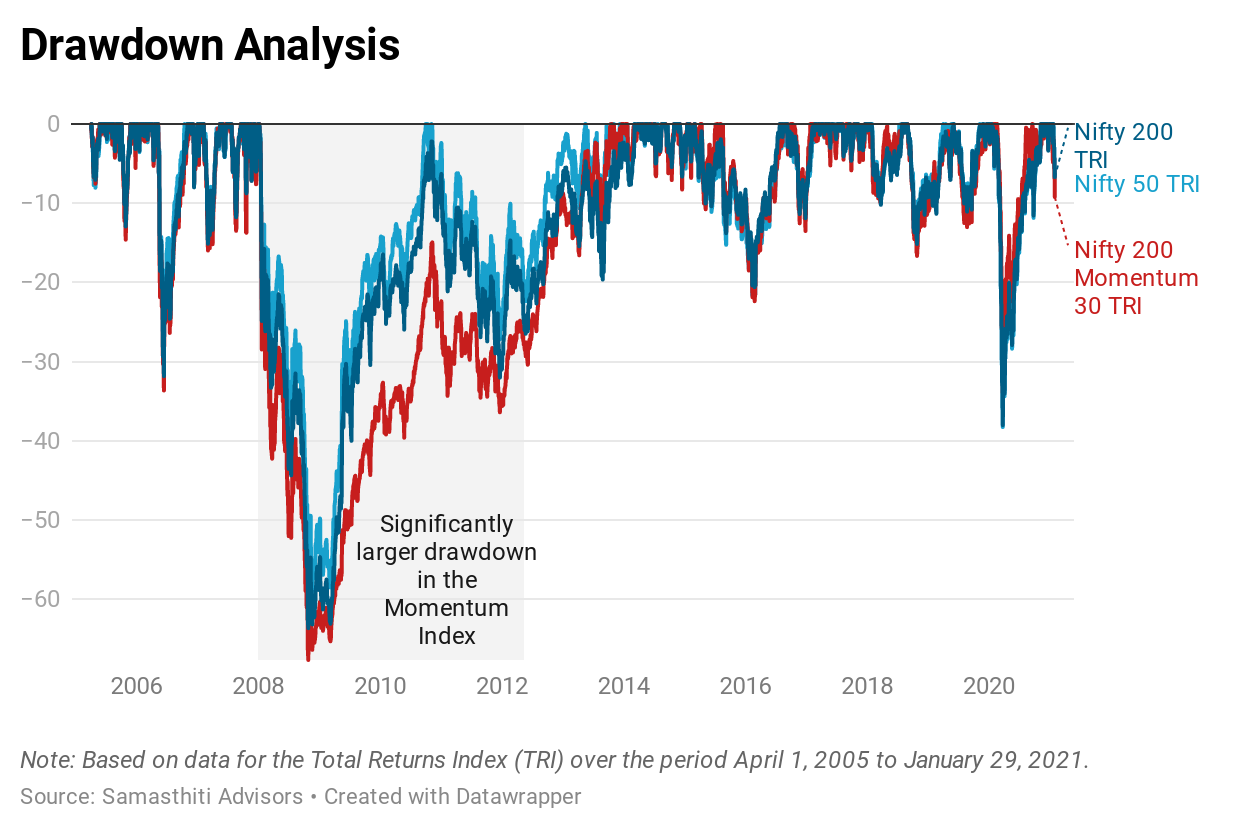
Another measure of risk when investing is the drawdown risk which is the extent to which your investment can fall in value. It is important to look at the historical drawdowns in an investment. An investment might have good return potential, but if it tests our resilience by falling significantly in value, we might fearfully exit the investment at a loss.
As can be seen in the above graphic, the Nifty 200 Momentum 30 Index displays significantly larger drawdowns in the period 2008-2012 compared to the Nifty 50 Index or the Nifty 200 Index. In the other periods apart from the 2008-2012 period, the drawdowns in the momentum index is only marginally higher, if at all.
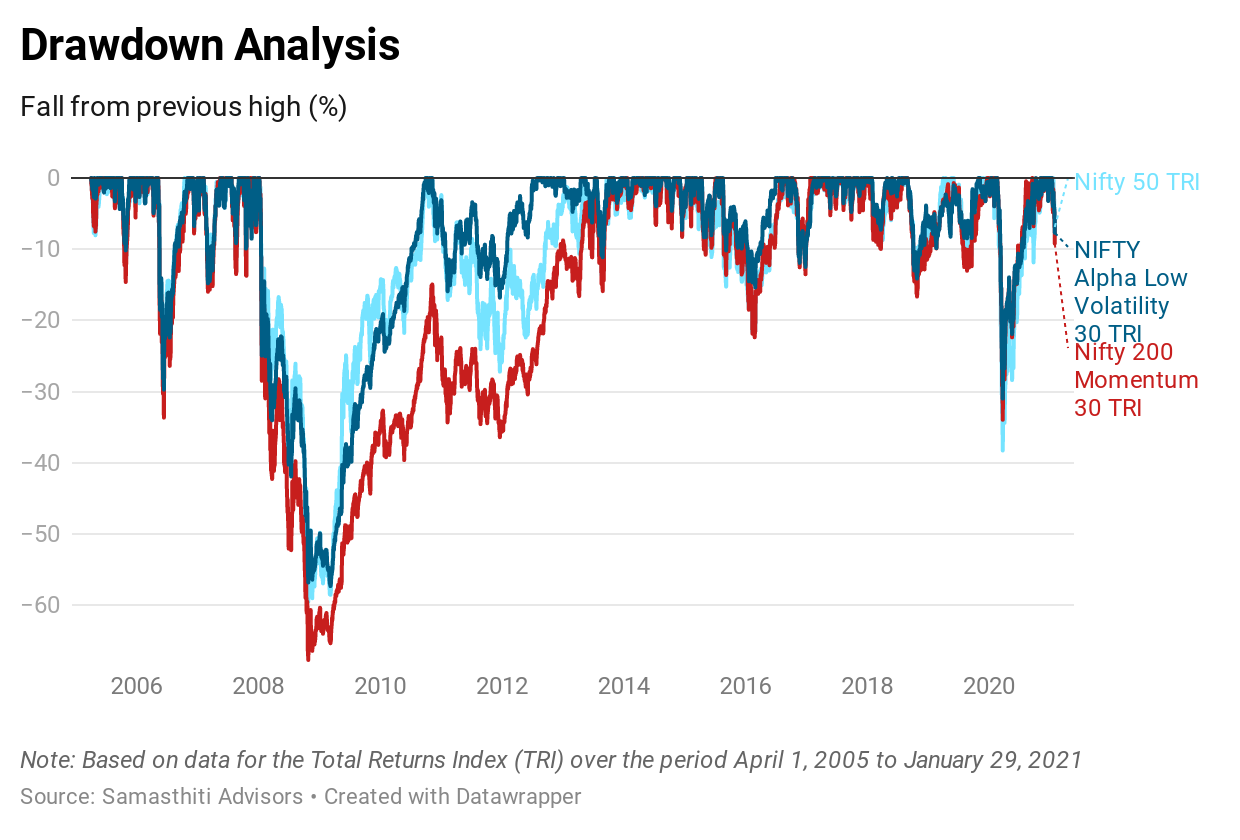
If you are curious to know what the drawdowns look like in the Nifty multi-factor low volatility indices, we have compared the drawdowns in the Nifty Alpha Low Volatility 30 Index below. As is expected, the low volatility index displays significantly mitigated drawdowns as compared to the momentum index.
Range of Possible Returns
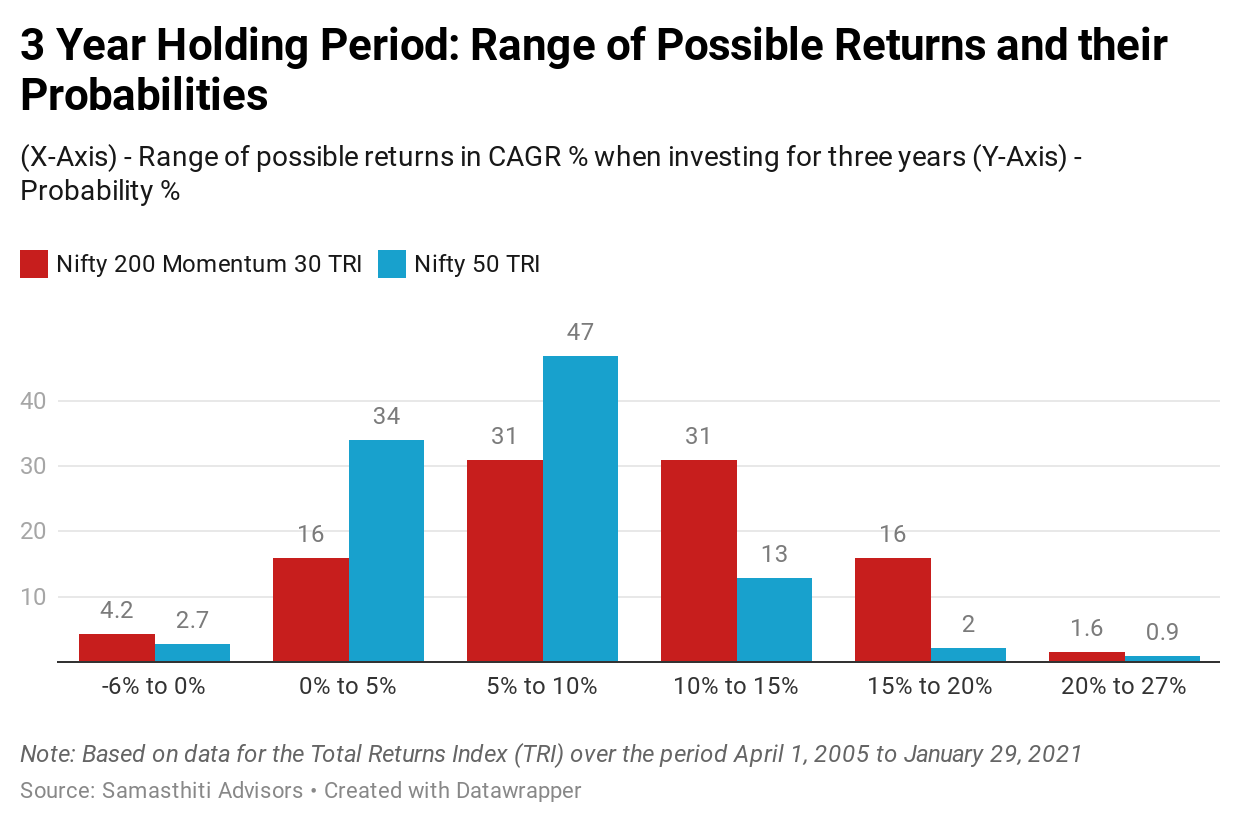
Another important aspect to look at is the range of possible returns that you can earn while investing in a product and what are the probabilities attached to those returns. For calculating this data, we need to first define the investing/holding period. We have done this analysis for two investing periods - 3 year and 5 year.
The above graphic may look complicated, but is very easy to interpret
This analysis has been prepared based on data from April 1, 2005 to January 29, 2021
The X-Axis represents the range of returns that you can earn when investing for a three-year period in the Nifty 200 Momentum 30 Index or the Nifty 50 Index. The range of returns (in CAGR) is from -6% to 27%
When investing for three year periods in the Nifty 200 Momentum 30 Index, there is a 4.2% probability that that you will earn between -6% to 0% return (CAGR). On the other hand, the probability that that you will earn between -6% to 0% return (CAGR) in the Nifty 50 Index is 2.7%
Thus, the momentum index has greater ‘tail-risk’ of earning negative returns
Investing in the momentum index and taking greater tail-risk only makes sense if you there is the potential for higher returns. If you look at the probabilities for the return between 10% to 15% (CAGR), or the return between 15% to 20% (CAGR), there is a significantly larger possibility of earning these high returns in the momentum index
For instance, the probability of earning 15% to 20% return (CAGR) for a three year investment is 16% for Nifty 200 Momentum 30 Index as compared to 2% for the Nifty 50 Index.
Broadly, if you look at the range of returns and the probabilities of those returns, it can be seen that the Nifty 200 Momentum 30 Index has a fat-tail (on either end of the distribution) as compared to the Nifty 50 Index. This means that the momentum index is more susceptible to extreme outcomes.
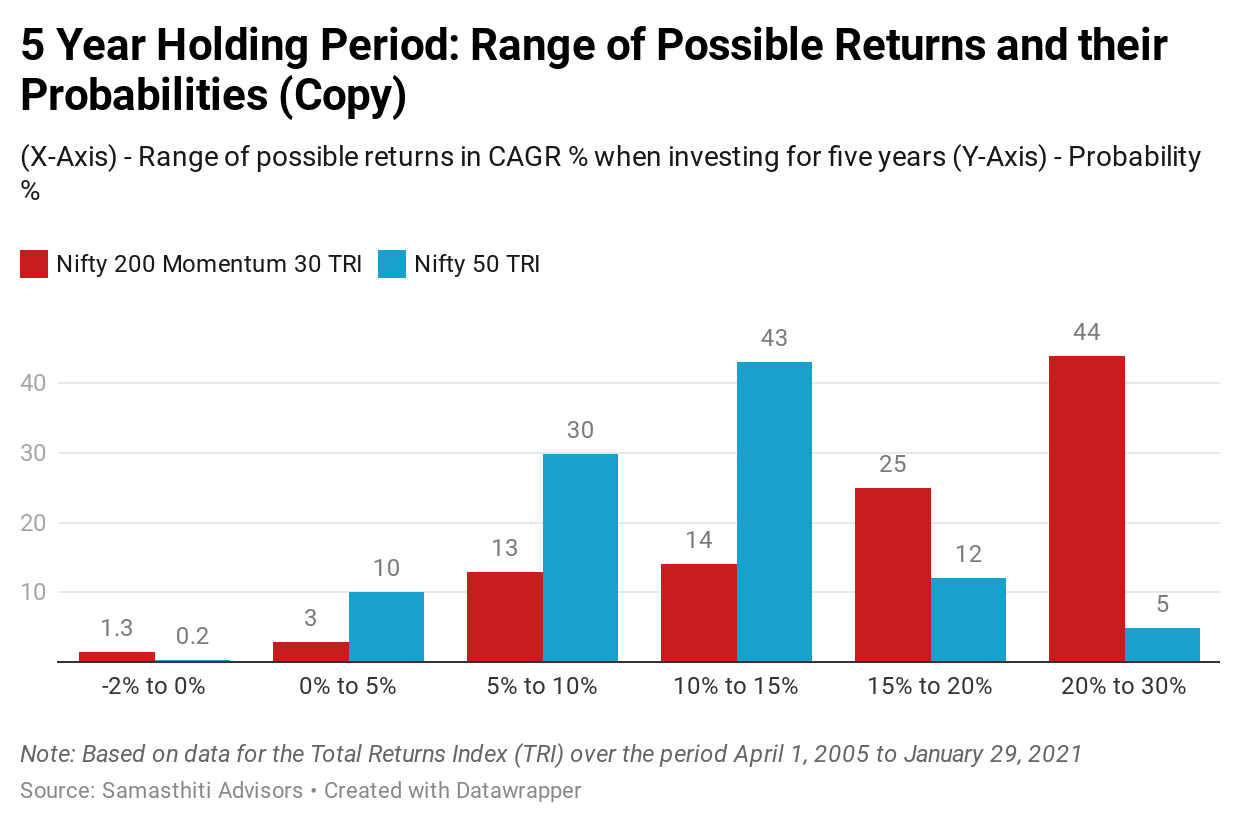
For those who are curious, we have provided below the data for the 5-year investment/holding period as well.
The story broadly remains the same, but you should note two points,
Investing for the 5 year period significantly reduces tail risk
The possibility of earning better returns increases significantly with an increase in the holding period
Summary
In summary, the UTI Nifty 200 Momentum 30 Index represents an attractive investment opportunity. Undoubtedly, the Index on which the product is based has delivered impressive return performance. Even when we adjust the returns for risk, the risk-adjusted return is good.
The key caveat to keep in mind is that the Index has limited live vintage and represents, as of now, a pre-dominantly back-tested investment strategy. Also, the product has higher tail-risks and exhibits higher drawdowns. Anyone investing in this product should be behaviorally prepared to ride out the volatility to earn the potentially superior return.
As our analysis shows, it is highly recommended to widen your investment horizon in the product as a longer investment duration is able to cut down the tail-risk and further improve the return profile in this product. The significantly better performance of the Nifty 200 Momentum 30 Index over a 5 year holding period as compared to a 3 year holding period could be due to the fact that the Index rebalances itself only over a semi-annual frequency.
Within the limited universe of factor funds in India, the UTI Nifty 200 Momentum 30 Index adds an important ‘momentum’ dimension. For investors looking to invest in a momentum strategy through a low-cost passive approach, the product offers a compelling option.
Subscribe now to our Youtube channel here
Disclaimer - No part of this post should be construed as investment advise. Please consult with your financial adviser before taking any action.


